Setting a Graphing Filter
These filters manipulate the data displayed and analyzed in your plots on the graphing interface. The [X] link next to each filter removes the associated filter from the list (or clears it, if there is only one), while the [Add Filter] link adds a new filter to the end of the list.
Interface Options
- all of / any of: Specify whether you want the data to satisfy all or any of the filters you listed.
- database column (drop-down): Select the database column you are going to be filtering on. See Graphing Fields <../frontend/Web/GraphingFilters> for more details.
- condition (textbox): Specify the condition you want to use for
the database column you specified. You may enter any condition that
is valid in a SQL WHERE clause. Examples:
- = 12345
- LIKE ‘kernbench%’
- REGEXP ‘bad-dimm0[^0-9]*’
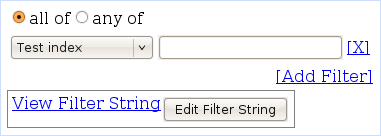
Filter String Viewer
In addition to the controls above, there is a viewer area in which you can see the SQL WHERE clause that the frontend is building. Click View Filter String to expand the textarea to show the clause. You may also click “Edit Filter String” to edit the WHERE clause yourself. You may use any of the fields specified in GraphingDatabaseFields <../frontend/Web/GraphingFilters>.